KeyLines
Update solution on May 3, 2018
KeyLines is in version 4.0, which was released in January 2018. This is a graph visualisation product, as illustrated in Figure 1 (this example is mapping data breaches), that allows you to examine relationships between entities and/or events. KeyLines is delivered as a toolkit for developers. It is browser-based and supports JavaScript and its variations (AngularJS, ReactJS and VueJS) as well as HTML5 and WebGL, so the graphics you can build can run on tablets and mobile devices as well as more enterprise-level hardware. Its user base is split approximately equally across companies using KeyLines with relational databases (via SQL support), all the leading graph databases (supporting Gremlin, Cypher and SQL as appropriate) and NoSQL databases such as MongoDB and Elasticsearch (via a RESTful API). KeyLines is embedded in Cambridge Semantics’ (a different company) ANZO data lake.
Customer Quotes
“Whenever you work with a technology, there are two very important aspects: first is the quality of the product, second is the support. With KeyLines, both of those have been excellent.” EclectIQ
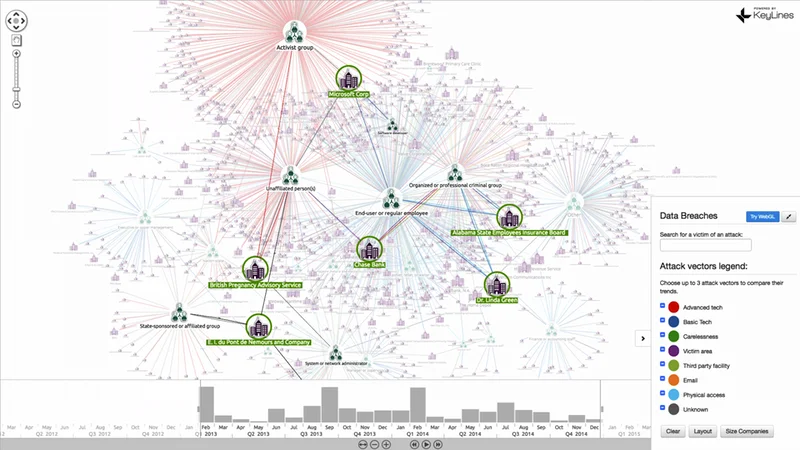
Figure 1
“KeyLines was chosen because it provided the level of support and documentation we needed [and] the best performance and the right combination of features to provide that intuitive access to data our users needed.” Microsoft
Major capabilities in KeyLines include support for a variety of layouts: standard, lens, hierarchical (sequential) and structural (where nodes are grouped into communities). For graph analytics it offers analysis by closeness, betweenness, page rank, Eigen centrality, degree and so on. Network filtering is available so that you can look at sub-networks. Social network analysis supports facilities to find both key players and major influencing paths as well as cluster detection algorithms. You can customise the appearance of the interface and any associated workflow. And there are geo-spatial capabilities that allow you to select any preferred map design, and to switch seamlessly between viewing the data in either network mode or map mode. In other words, all the sorts of capabilities you would expect.
However, KeyLines also has a couple of capabilities that you might not expect. The first of these is the time bar (the histogram at the bottom of Figure 1). This not only supports filtering by time but allows you to select specific periods to look at, to track changes over time and to watch nodes appearing and disappearing over time. You can combine time-based filtering with geo-spatial mapping, which Cambridge Intelligence reckons to be a significant differentiator for KeyLines.

Figure 2
The second unusual – as far as we know unique – feature of KeyLines, has just been introduced in the latest version. This is the ability to combine nodes by one or more pre-defined attributes, and open individual nodes for more detailed exploration. As an example of this, Figure 2 shows a telecommunications infrastructure organised by country and region. This is a drill-down from a network map, where the nodes had all been combined into London, Edinburgh, Paris and so on; but the user has opened the Edinburgh node to examine this in more detail. This approach makes it much easier to understand and investigate clusters of data, which can often become very complex because of large numbers of edges and nodes.
Graph visualisation is becoming more and more important, as organisations start to appreciate that relationships are all around us, and that they need to understand and leverage those relationships. Unfortunately, these relationships are both multiple and complex, and graph visualisation provides a way to explore these networks of things, people and events. But graphs can all too often look like spaghetti, so methods of simplifying the environment are important, as witness the pull-quote from Microsoft.
The Bottom Line
We like KeyLines. It does all the complicated stuff that you would expect, but it is its efforts to make graph analysis and visualisation simple that we particularly like.
Related Company
Connect with Us
Ready to Get Started
Learn how Bloor Research can support your organization’s journey toward a smarter, more secure future."
Connect with us Join Our Community