Cambridge Intelligence Keylines InBrief
Published On 14th, Oct 2020 Content Copyright ©
2024 Bloor, All Rights Reserved.
2024 Bloor, All Rights Reserved.
Classification
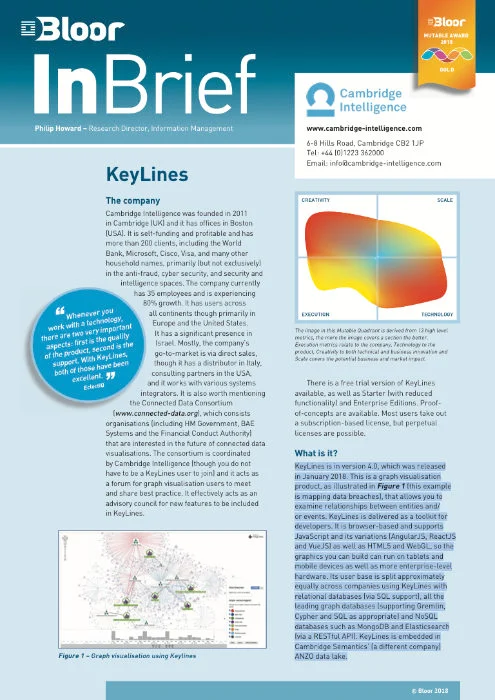
Graph visualisation is becoming more and more important, as organisations start to appreciate that relationships are all around us, and that they need to understand and leverage those relationships. Unfortunately, these relationships are both multiple and complex, and graph visualisation provides a way to explore these networks of things, people and events. But graphs can all too often look like spaghetti, so methods of simplifying this environment are important. And this is exactly what Keylines does.
Research By

Related Technologies
Related Companies
Connect with Us
Ready to Get Started
Learn how Bloor Research can support your organization’s journey toward a smarter, more secure future."
Connect with us Join Our Community