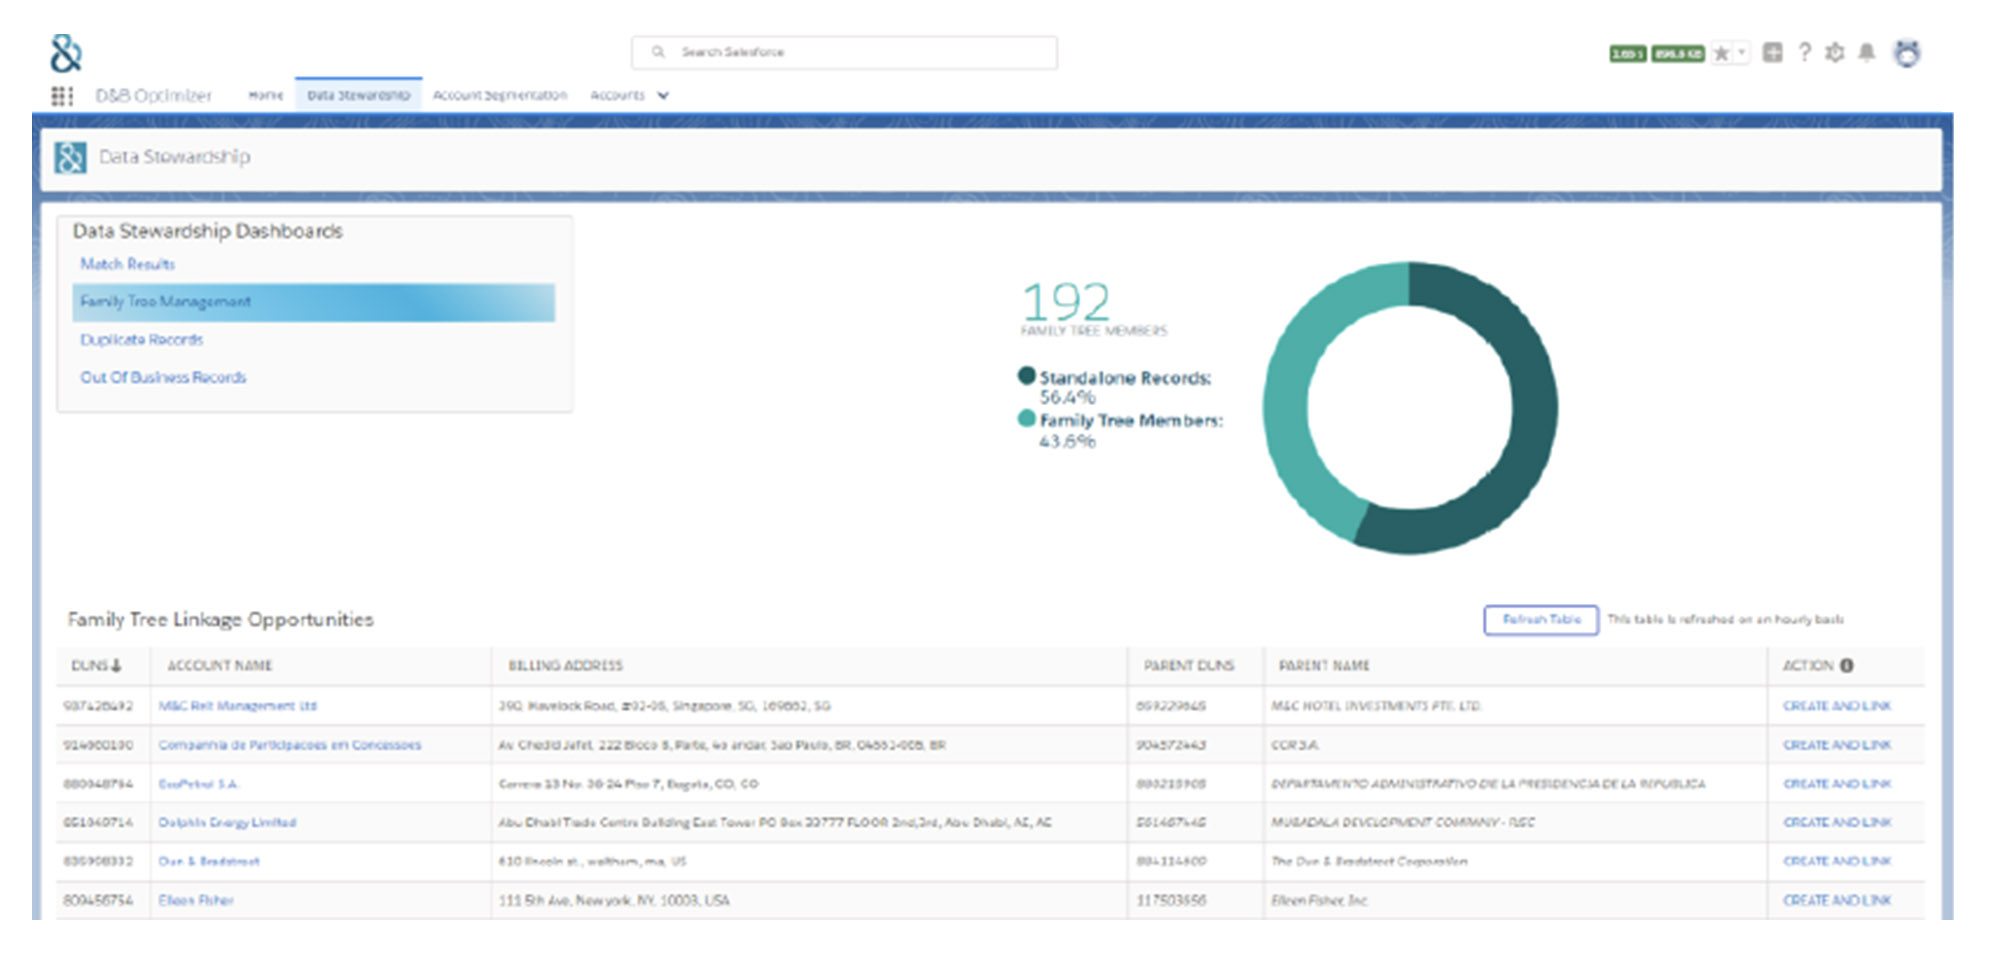
Fig 1 - The D&B Optimizer data stewardship module
There are multiple steps employed when you use D&B Optimizer. Firstly, there is native integration with key systems. Including Salesforce, Marketo and Eloqua, as examples. Secondly, there is data profiling, which will help determine where there are errors and duplicates within your existing data. Thirdly, there are cleansing and matching capabilities, including the ability to validate not just addresses but also email addresses, IP addresses and phone numbers. In this context, it is worth noting the ability, at the point of entry, to search and select companies, and identify duplicates, before they are created within the system. A data stewardship module, illustrated in Figure 1, helps with remediation processes. You can also enrich your data from third party sources from information held within the Dun & Bradstreet Data Cloud. A typical D&B client will have more than a hundred enriched attributes.
None of this is particularly differentiated from other tools on the market, save for the focus on companies rather than consumers. Where D&B Optimizer stands out is in the way that it leverages the information in the Dun & Bradstreet Data Cloud. Thus, for example, the product’s visualisation capabilities will allow you to explore the ownership of companies in a family tree type manner. Further, the software will automatically recognise changes to customer/supplier details such as when, for example, a company you are dealing with has gone out of business. This is important because it happens all the time. For example, Radius Business Graph has published a report that looked at the average number of data errors that accumulate, every three months, within a database of 10,000 business clients. It found that 210 phone numbers will disconnect, because the business had closed or moved; 418 phone numbers will change; 592 business addresses will become invalid; 757 contacts won’t connect, either because they have moved to new jobs or change employment; and 252 email addresses will become invalid. D&B Optimizer may not be able to pick up all of these, but should be able to minimise this ongoing problem.

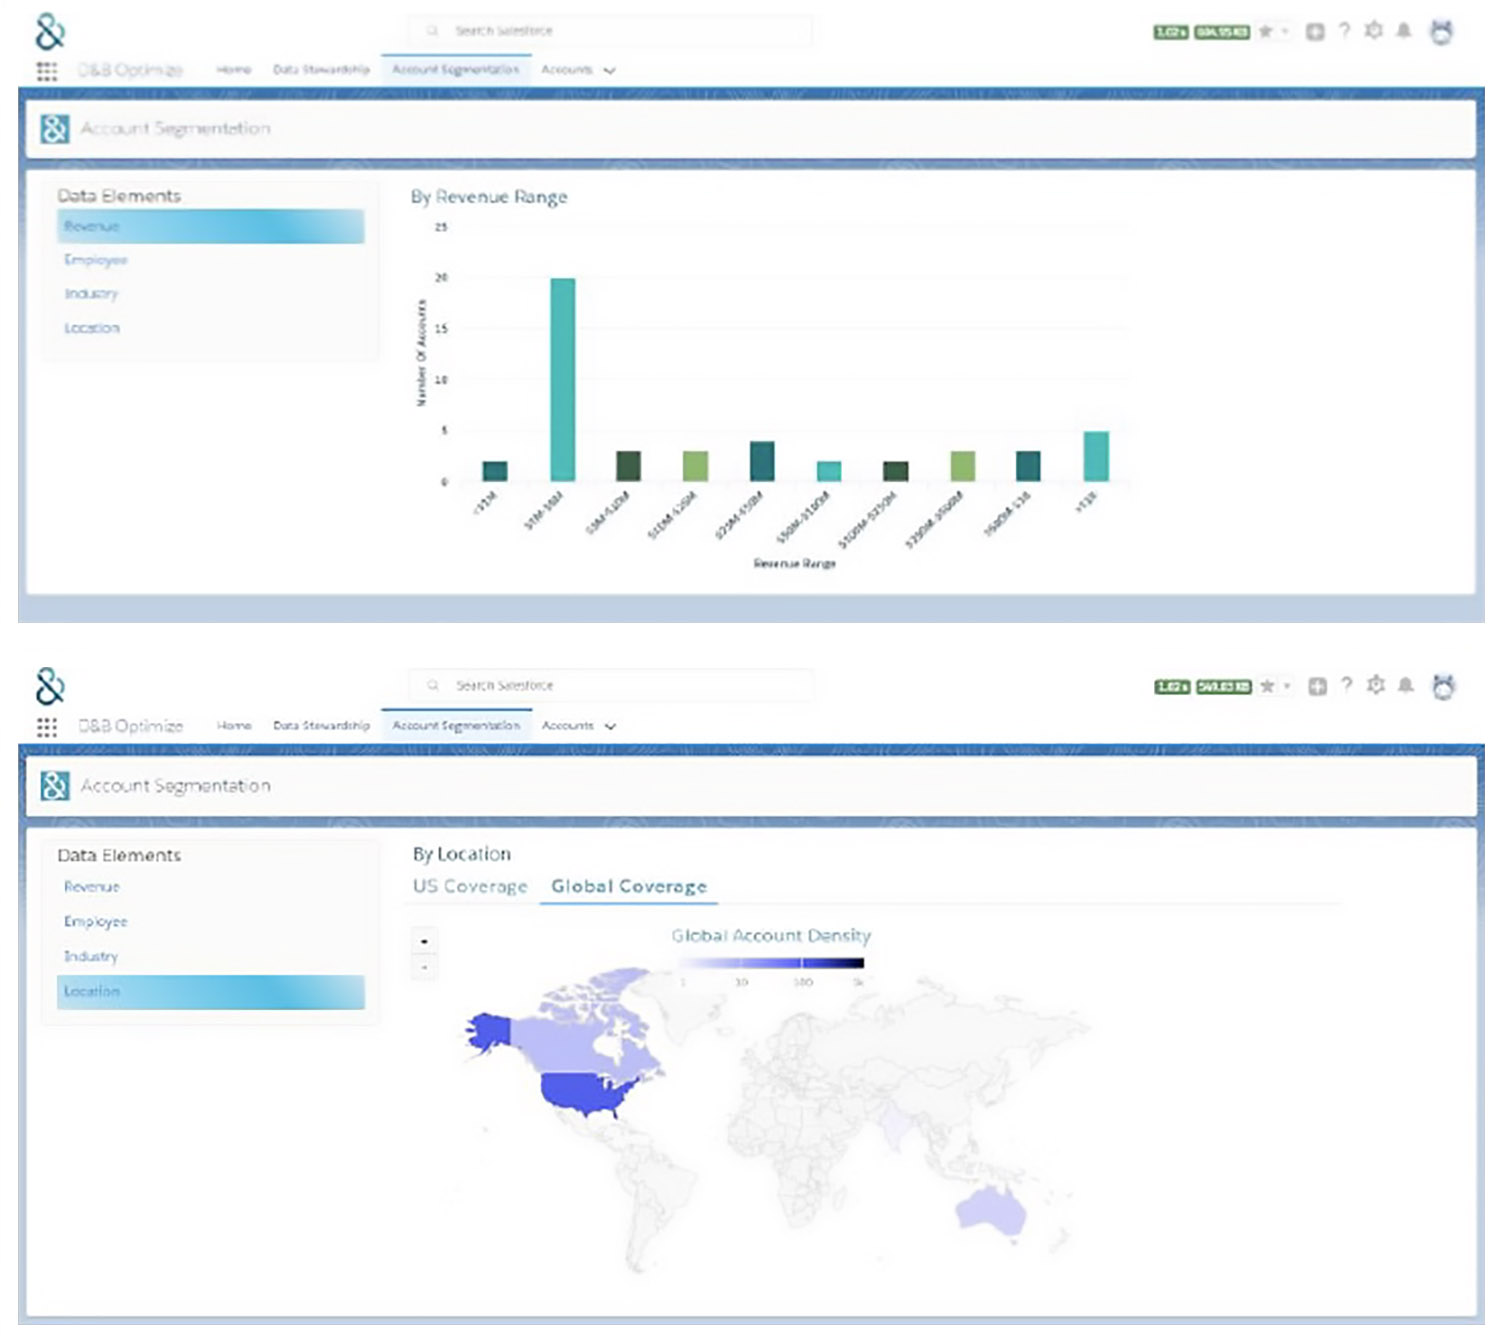
Fig 2 - Dynamic dashboards in D&B Optimizer
Data analysis and its visualisation is another differentiator compared to other data quality vendors that do not extend to this sort of capability. For example, see Figure 2. These (dynamic) dashboards allow you to visualise key market segments to help support your marketing efforts.
In the top chart, accounts are broken down by revenue, industry, and the number of employees; while the lower chart is intended to support territory planning.


